T H E H I S T O G R A M O N Y O U R C A M E R
A :
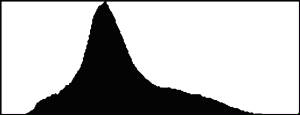
P R O P E R L Y E X P O S E D:
Your digital camera should be able to display a historgram on the screen at the back. This shows the
way tones are distributed in your photograph from dark tones on the left to light tones on the right
Ideally an in-camera histogram should have the tones distributed around the middle of the chart, with
none butting up to the left or right-hand edges of the histogram. This allows for a full gradation in your photograph from
black to white.
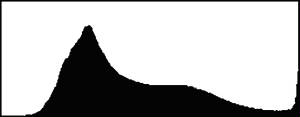
U N D E R - E X P O S E D:
In the example above the tones are all bunched up at the
left of the chart. This shows that the dark tones are merging with the blacks, and it may not be possible to see details in
the shadow areas of your photograph.
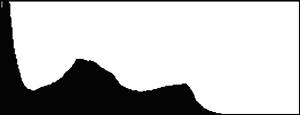
O V E R - E X P O S E D:
In this example the tones overshoot the right of the graph.
This means that the highlights are “blown” as they are not being recorded by the camera sensor. They appear as
white in your photograph. This is really only acceptable for the very brightest of highlights in a photograph - for example
sunlight speckles on water (See the zone system of exposure)
Where there is a stark choice between losing the highlights
and not recording the details in the shadows, it is better NOT to blow the highlights. Allow the shadows to merge
with black instead as this makes for a more aesthetically pleasing photograph.
|